TradingView
Indicators
Professional Pine Script indicators bringing De Casteljau mathematics, Kalman filtering, Hurst Exponent analysis, and ML ensembles directly onto any TradingView chart. All markets, all timeframes.
Quantum DeCasteljau v10.7 PRO ML
Live on Gold (XAUUSD) 30m — De Casteljau curves overlaying price action, 4-model ML ensemble voting panel, ATR-based risk levels, three take-profit targets with pip tracking, session detection, and a rolling performance dashboard.
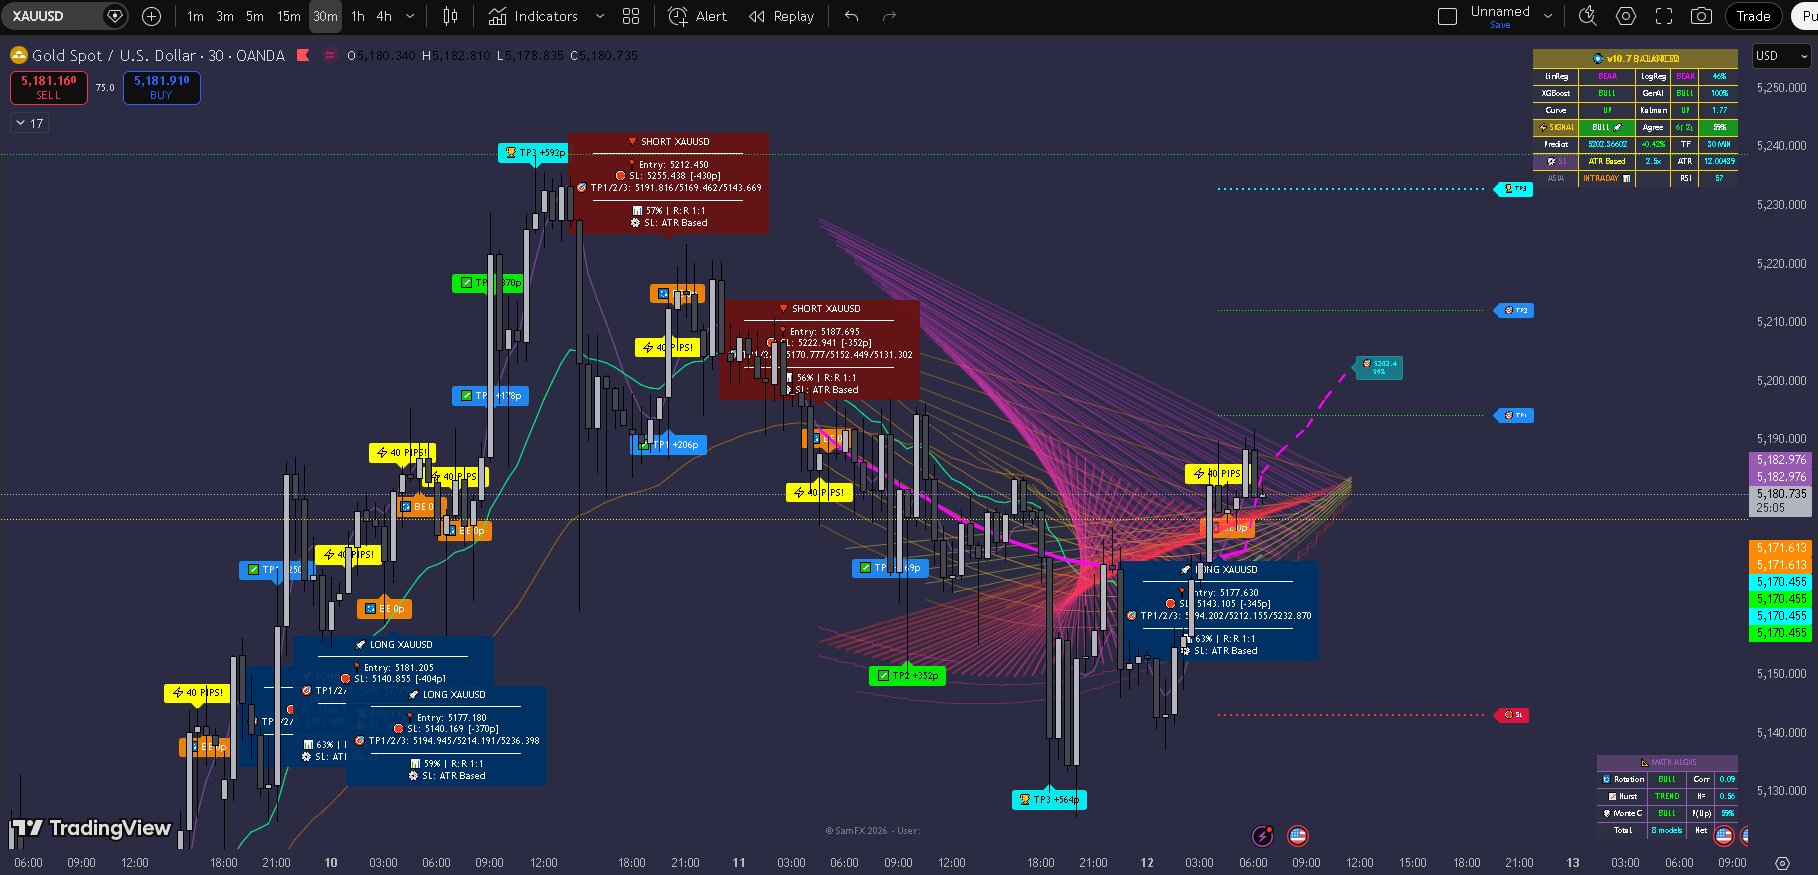
ML Ensemble Voting Panel
Four models — LinReg, LogReg, XGBoost, GenAI RL agent — each cast BULL/BEAR/NEUTRAL votes. Agreement Score quantifies consensus; only high-agreement signals fire.
3-Level TP with Pip Tracking
Three take-profit levels from De Casteljau projections. Each TP hit is marked on the chart with pip gains — TP1 (+324p to +435p), TP2 (+885p to +907p), TP3 (+1451p).
Session-Aware Timing
Auto-detects London, New York, and Asian sessions with intraday markers. Volatility expectations adapt per session — New York carries different ATR profiles than Asian ranges.
Rolling Performance Dashboard
Live returns across 6 windows: 1W (+6.56%), 1M (-12.50%), 3M (+8.10%), 6M (+21.25%), YTD (+8.10%), 1Y (+49.35%). Full transparency — no cherry-picked backtests.
Kalman Filter + Curve Divergence
Kalman filter strips microstructure noise; Curve Divergence (DIVR) flags potential reversal zones before they confirm. Both states displayed live in the signal panel.
ATR-Based Risk Calibration
Stop loss and TP levels computed from live ATR (e.g. ATR 15.95 on Gold). Risk adapts to volatility — tighter in calm markets, wider in volatile sessions. R:R ratio shown per signal.
All Indicators
Click any card to view details, presets, and download links.
4-model ML ensemble with De Casteljau Bézier curve mathematics, Kalman filtering, ATR-based SL, 3-level TP tracking with pip gains, session detection, and rolling 1Y performance dashboard.
Pure Kalman filter trend line with velocity bands. Crystal-clear trend direction without lag.
Real-time Hurst Exponent calculation classifying the market as trending, random walk, or mean-reverting.
Simulates thousands of price paths to build statistical probability envelopes around current price.
Standalone Bézier string art visualization — turns the price curve into a stunning mathematical artwork with configurable colour schemes.
Aggregates trend direction from H1, H4, D1 onto your chart. Only trades when all timeframes align.
Add to TradingView in 3 steps
Upgrade your entire trading setup.
Combine TradingView indicators with the Chrome Extension, Institutional Edge desktop app, and the AI Brain LSE 2026.